GroundWork Monitor 8, Enterprise Edition
Tech Stack:


🎯 Groundwork Monitor 8™: A Scalable Unified Monitoring System
Our customer, Diamanti hired the Bluesunrise team to create the latest versions of the Groundwork Monitor 8. GroundWork Monitor 8, Enterprise Edition, is a powerful IT monitoring software for physical, virtual, and cloud-based infrastructures. GroundWork can monitor your entire IT environment. “If you use it, we can monitor it.”
🧩 About the Client: Diamanti’s Groundwork Enterprise Monitor
Diamanti is a well known Kubernetes innovator who has specialized in improving performance of Kubernetes networks and storage devices. The Groundwork Monitor is an addition to their suite of Kubernetes products. We were hired to modernize the Groundwork product stack, make it scalable, and increase performance. Groundwork has its origins in open source, known as the Groundwork Open Source monitor. It integrated various open source products such as Nagios and NeDI in a loosely couple but heavy and hard to manage system (tech debt) based on aging Perl monitoring checks in Nagios.
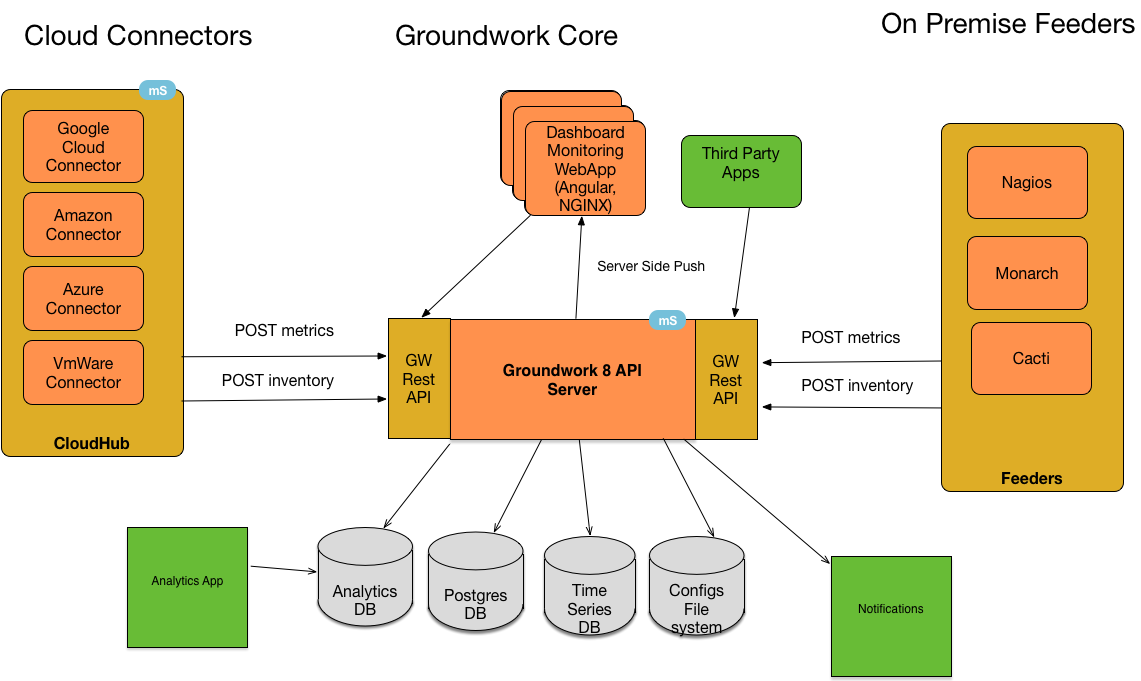
With the new architecture, we introduced a new containerized stack, based on Docker Compose. We are also working on running Groundwork 9, a new version of Groundwork Monitor, in Kubernetes. That is the subject of another blog. Lets first look at what we did for Groundwork 8:
-
Docker compose containers for each subsystem and integrated open source integrated product
-
Complete redesign and rewrite of the heavy user interface, replacing with a API driven light weight UI app
-
Scalability through the new Groundwork Messenger for Real Time Eventing
-
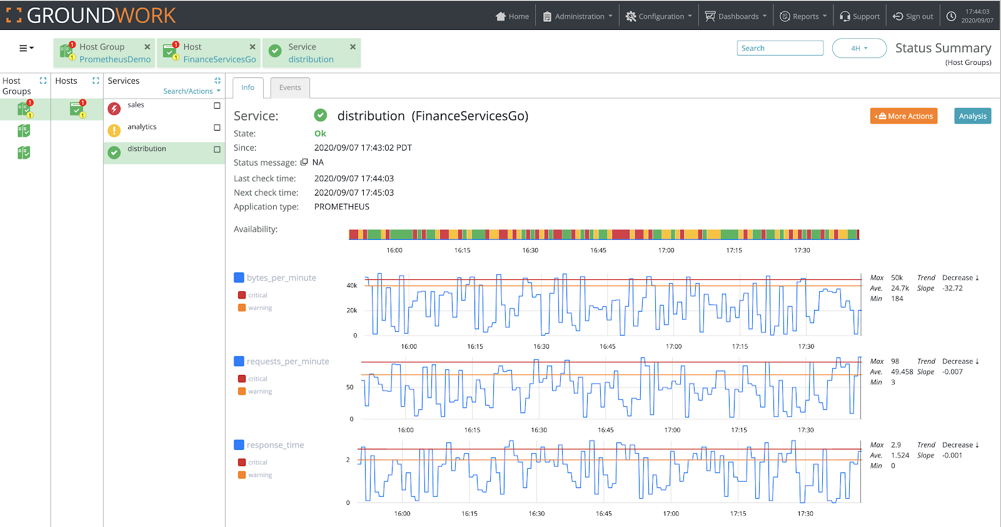
TCG Transport, a new fast monitoring data transport for integration with standards like Prometheus and Open Telemetry
-
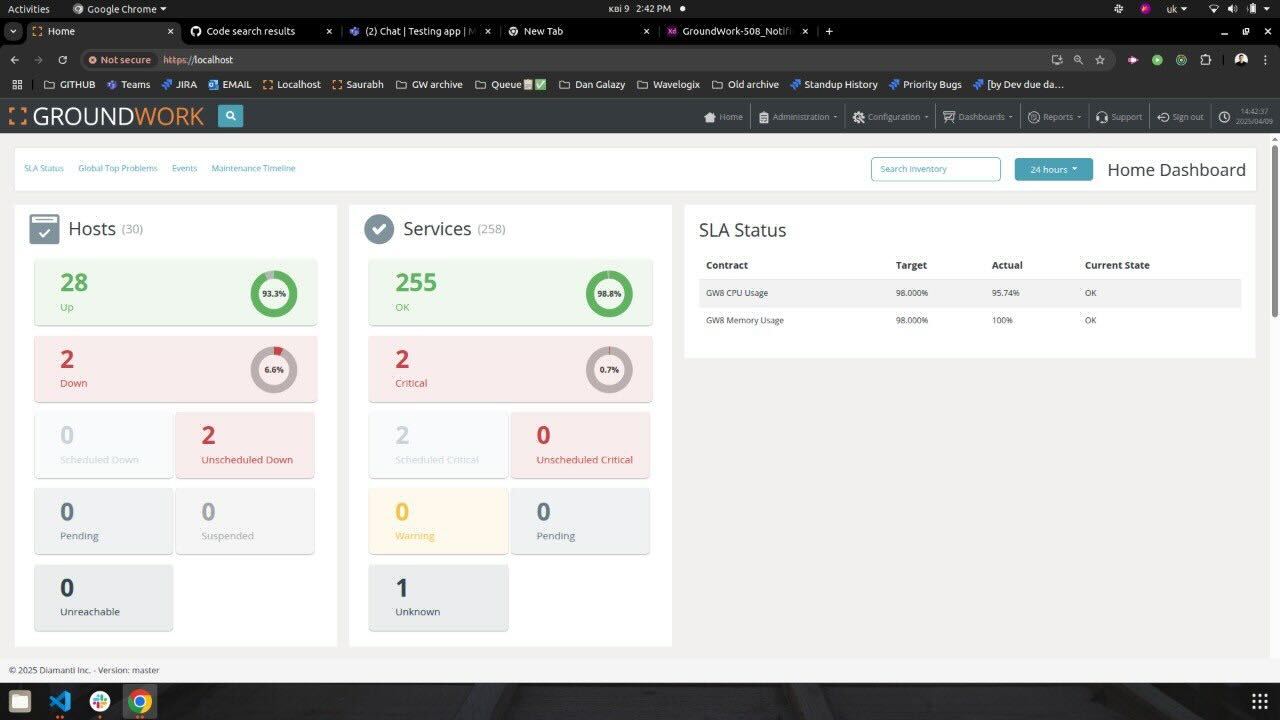
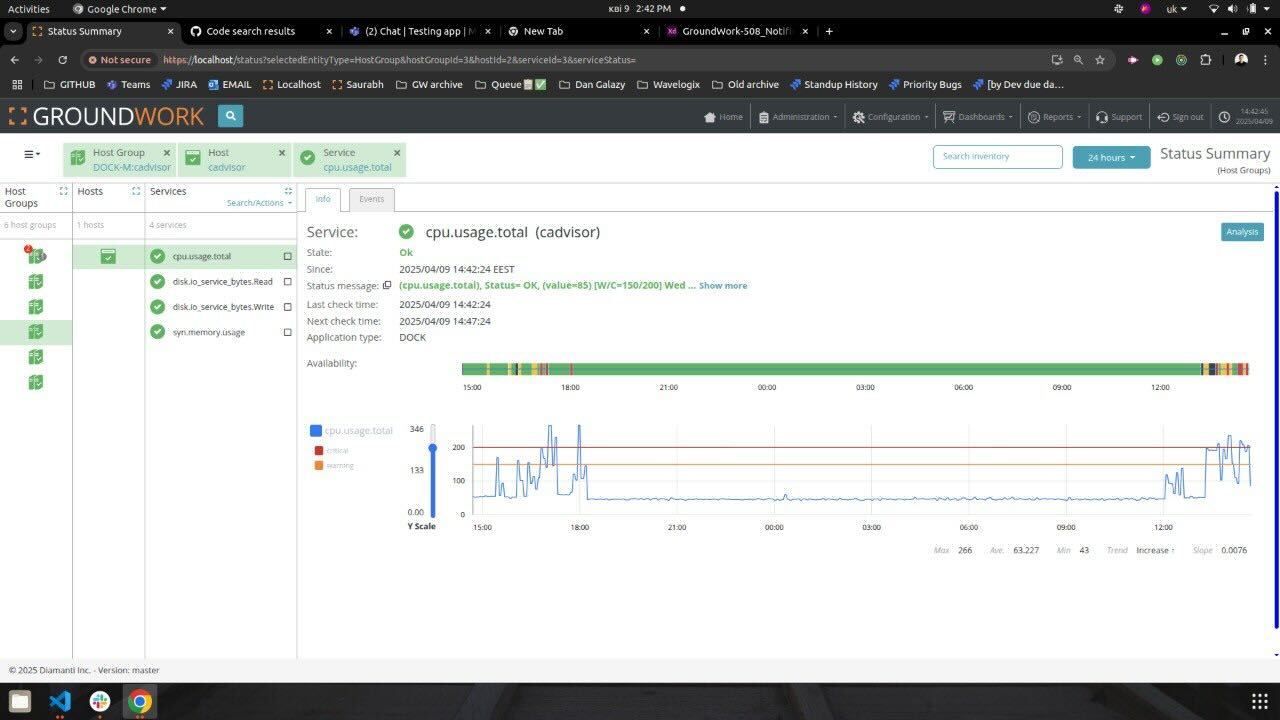
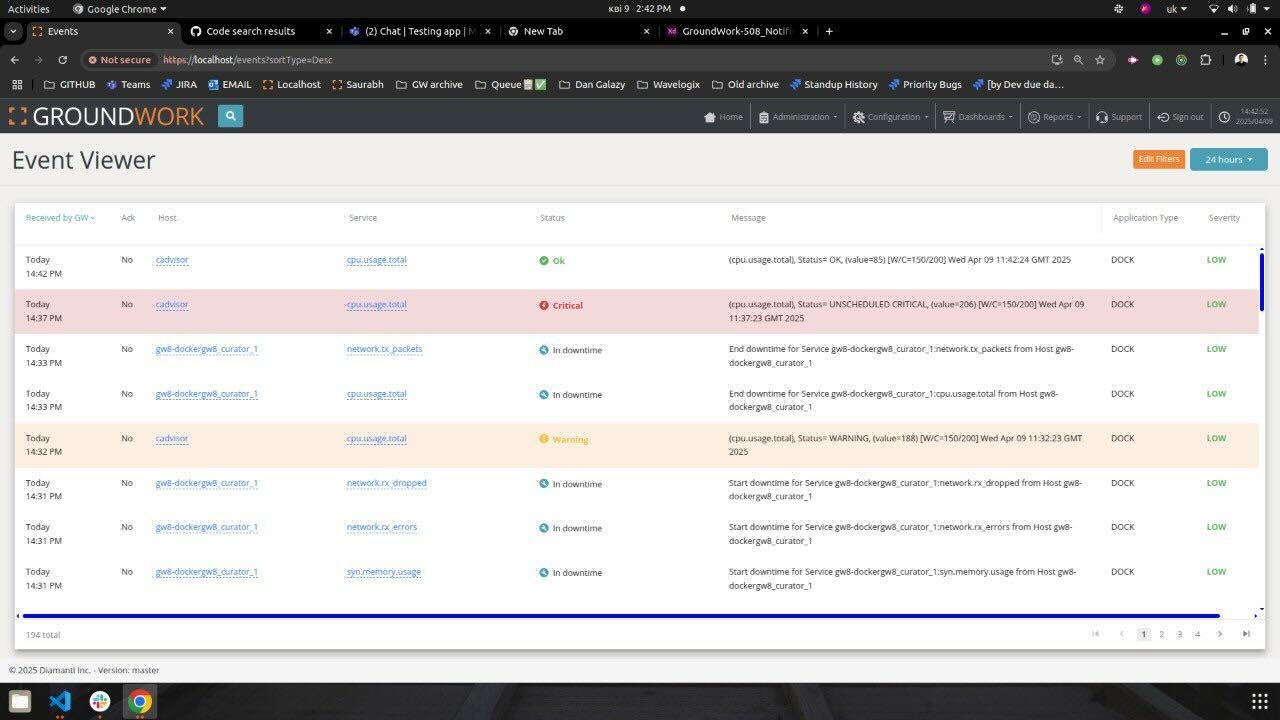
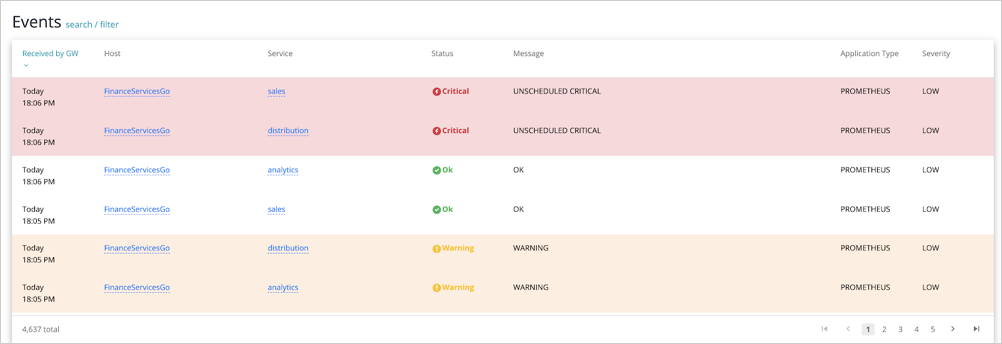
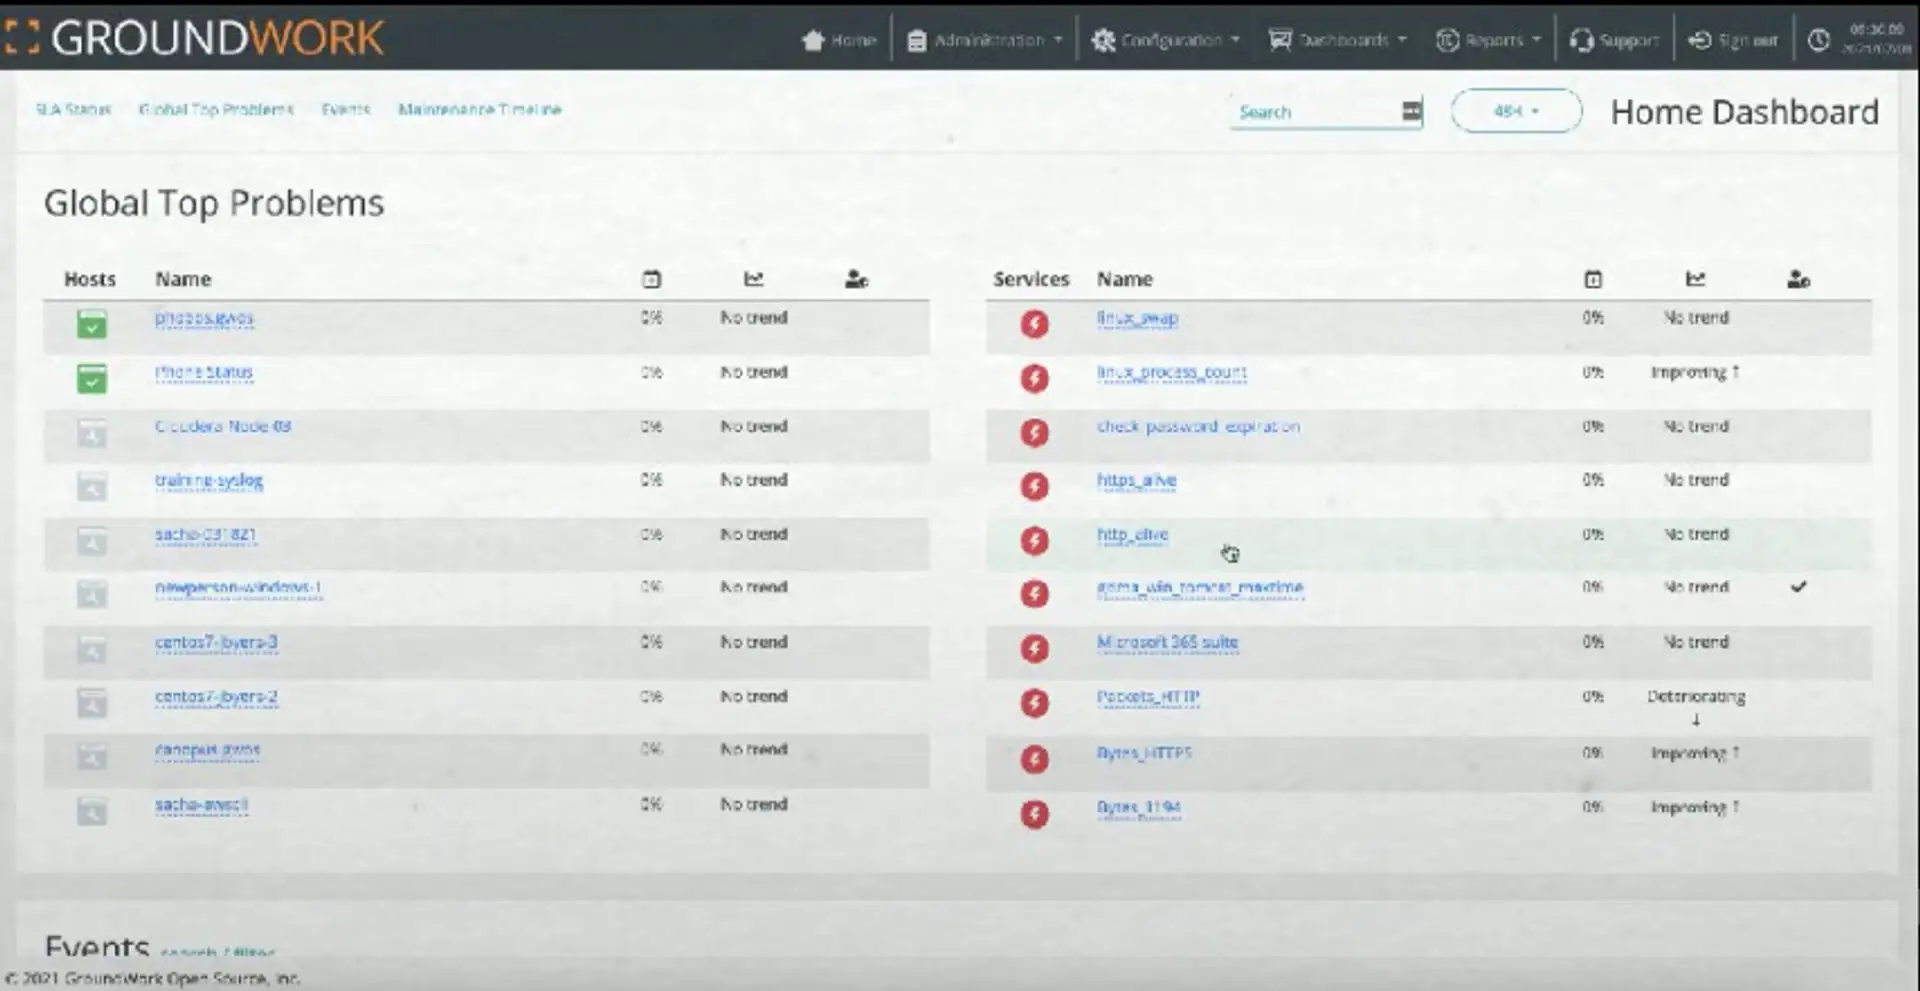
New UI Components including NOC Boards, Event Viewer, SLA Dashboard and Configurable Menus and Dashboards
-
Strong RBAC Security System across all components and integrations
-
Integration with industry leading monitoring tools such as
- InfluxDB
- Grafana
- Prometheus
- Kibana
- Jaeger
- Logstash
- CAdvisor
- Open Telemetry
- Elastic Search
- Elastic Beats
-
Continued and improved Integration of legacy monitoring tools
- Nagios
- Nedi
Application Performance Monitoring
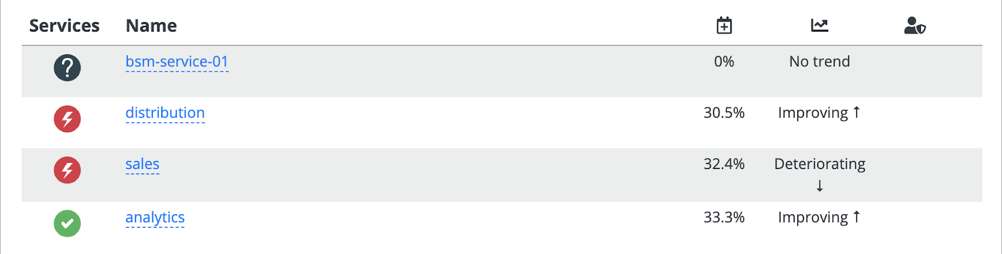
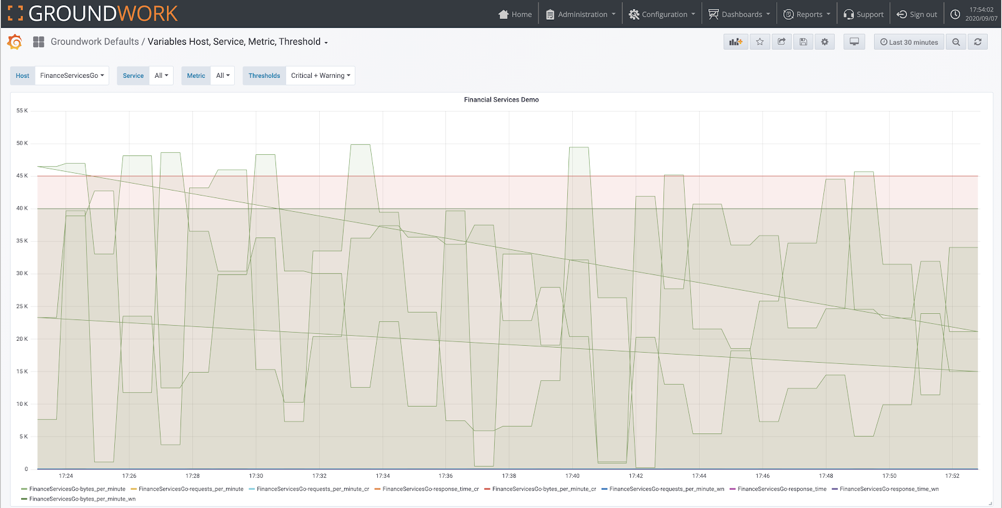
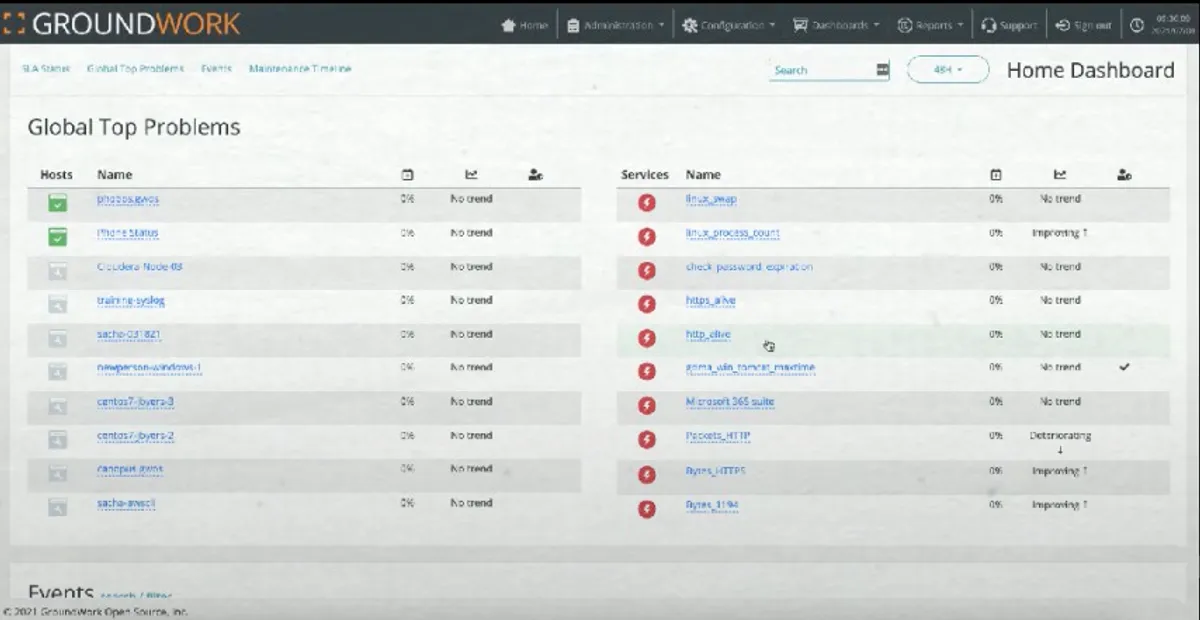
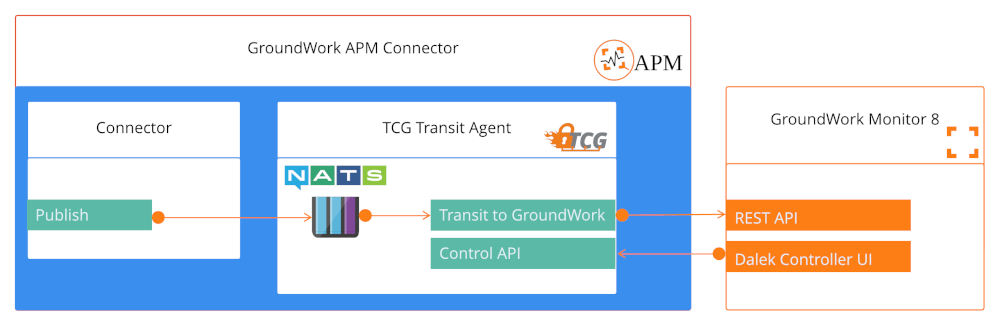
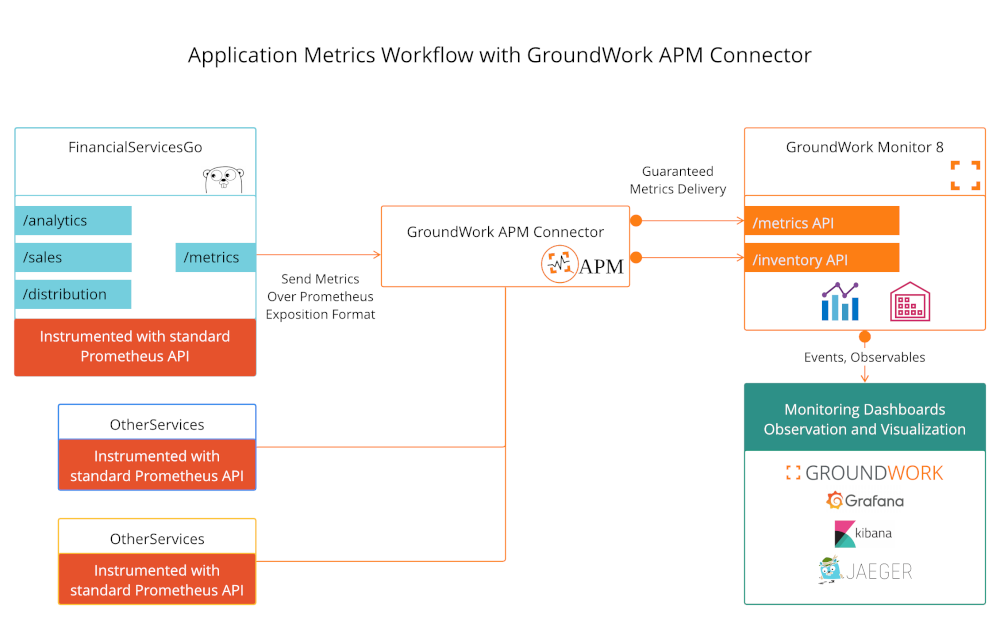
At Bluesunrise, we are strong believers in standards. Here is a diagram of how our new pipeline (NATS queue) architecture, which queues Metrics and Inventory from the new connector component. This monitoring data won’t be removed from the queue until they are delivered to GroundWork Monitor. Once they are received by GroundWork Monitor, they are immediately made available to the GroundWork Monitor dashboards, Global Top Problems as well as other visualization applications that we integrated like Grafana, Kibana and Jaeger. All of these visualization UIs are packaged with GroundWork Monitor 8 out-of-the-box.
Here are examples of the User Interface work we did for our customer: